
Attendance over time
How busy your club is, and how that changes through the year.
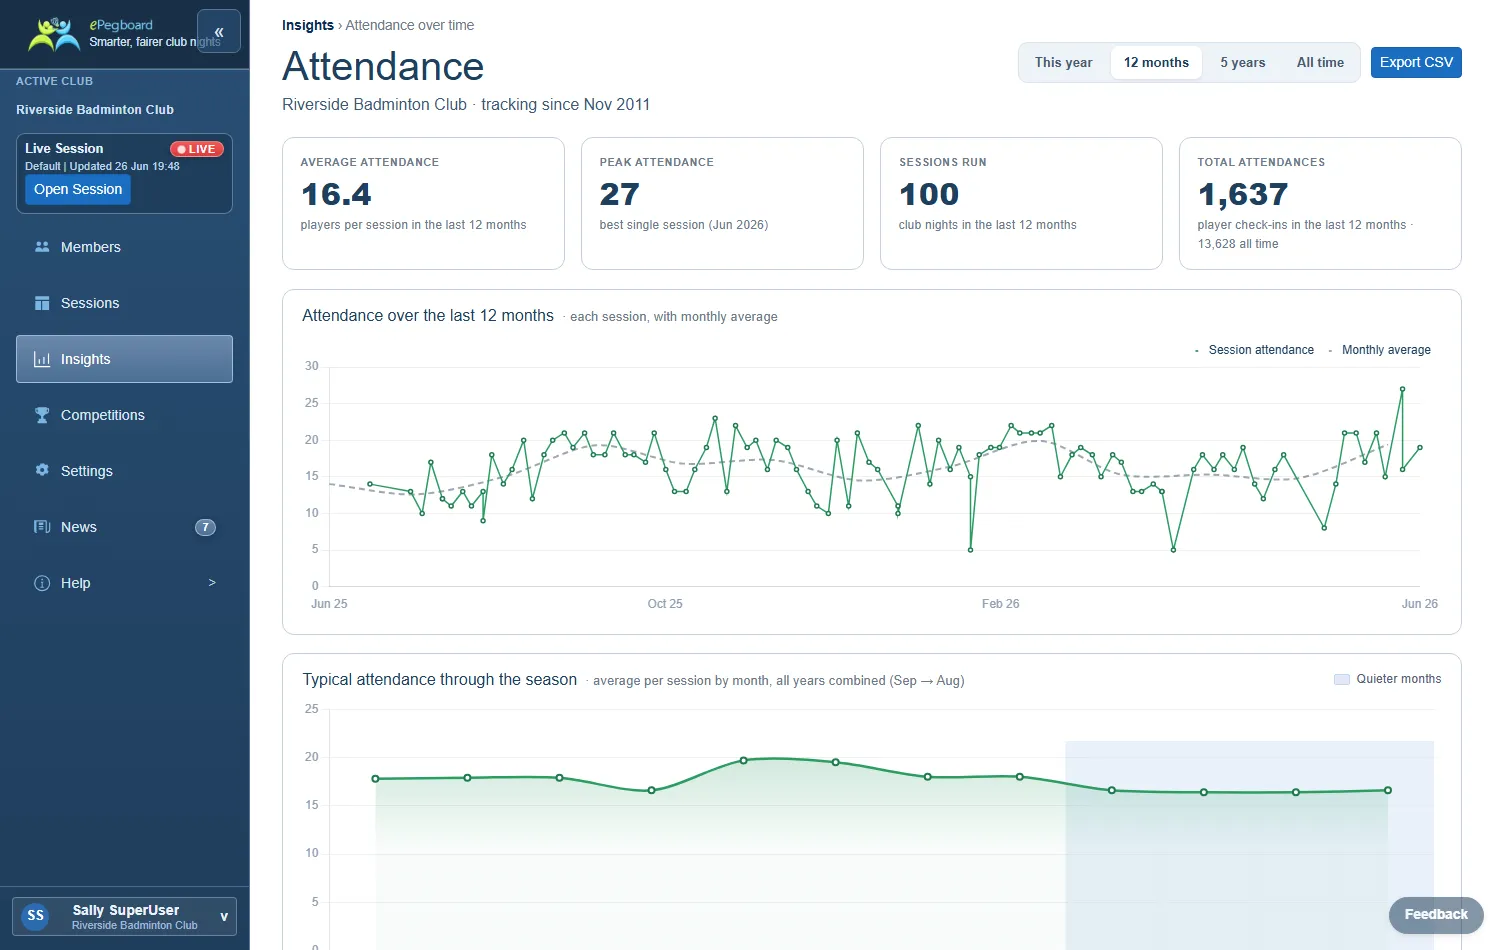
Shows your average and peak attendance, the number of sessions run, and total attendances - for the range you pick and all-time. Charts cover the month-by-month trend (with a rolling average), the typical shape of a season (the average for each month across all your years), and the annual total for each year.
Use it to see whether the club is growing or quieter than it was, to spot the seasonal pattern (the usual September lift, the summer dip), and to plan court bookings around the busy and slack times of year.
Related
Section titled “Related”- Insights and reports - all the reports in one place.