Insights and reports
This page covers the reports in ePegboard: what each one shows and what an organiser uses it for. They turn the data your club generates every session into a picture you can act on - who is drifting away, which nights are busiest, whether fees are being collected, which pairs play well together.
You will find them under Insights in the menu, or at /reports. Most reports have a date-range selector and a Download CSV button, so you can pull any view into a spreadsheet.
The Insights home page shows a card for each report with a quick headline figure, so you can glance at the state of the club before opening any single report.
Attendance over time
Section titled “Attendance over time”How busy your club is, and how that changes through the year.
Shows your average and peak attendance, the number of sessions run, and total attendances - for the range you pick and all-time. Charts cover the month-by-month trend (with a rolling average), the typical shape of a season (average for each month across all your years), and the annual total for each year.
Use it to see whether the club is growing or quieter than it was, to spot the seasonal pattern (the usual September lift, the summer dip), and to plan court bookings around the busy and slack times of year.
Session summary
Section titled “Session summary”Every session in one sortable table.
Each row is a session: date, title, profile, venue, attendance, games played, voided games, and status (draft, live or completed). Click through to open any session. Filter by date range or session profile.
Use it to scan recent nights at a glance, compare attendance across sessions, spot nights with a lot of voids, and jump straight into a session to check the detail.
New member conversion
Section titled “New member conversion”Whether the people who try your club stick around.
A funnel from tried (first visit) through came back, became a member, and still active, with the drop-off at each stage. This is a matured view - it looks at people who first came long enough ago to have had a fair chance to settle, so it reflects what actually happens rather than this month’s newcomers who have not had time yet.
Use it to see how well your club converts curious first-timers into regulars, and to find the stage where you lose people so you can target it (a better welcome, a follow-up message, a buddy for their second visit).
Attendance trends
Section titled “Attendance trends”Who is drifting away, and who to contact now.
The headline strip splits members into active (played recently), lapsing (quiet for a while), dormant (away a long time) and new. A drift map plots each member by how long since they last came against how many sessions they have played, so regulars who have gone quiet stand out. A “reach out now” spotlight surfaces the most consistent members who have recently dropped off, and the full sortable table (with a per-member trend sparkline) lets you work down a list for outreach.
Use it to catch regulars before they drift away for good, and to build a contact list of exactly who to nudge.
Member engagement
Section titled “Member engagement”The shape of your membership - core regulars versus occasional drop-ins.
Shows how many members are active, how many are core (regular and frequent), the average sessions per member, and how many are occasional attenders worth re-engaging. A banded chart groups members by how often they play; click a band to drill into the list of who is in it.
Use it to understand how much of your club is a committed core versus a long tail of occasional players, and to pull the list of “rare” attenders you might re-engage.
Partnerships
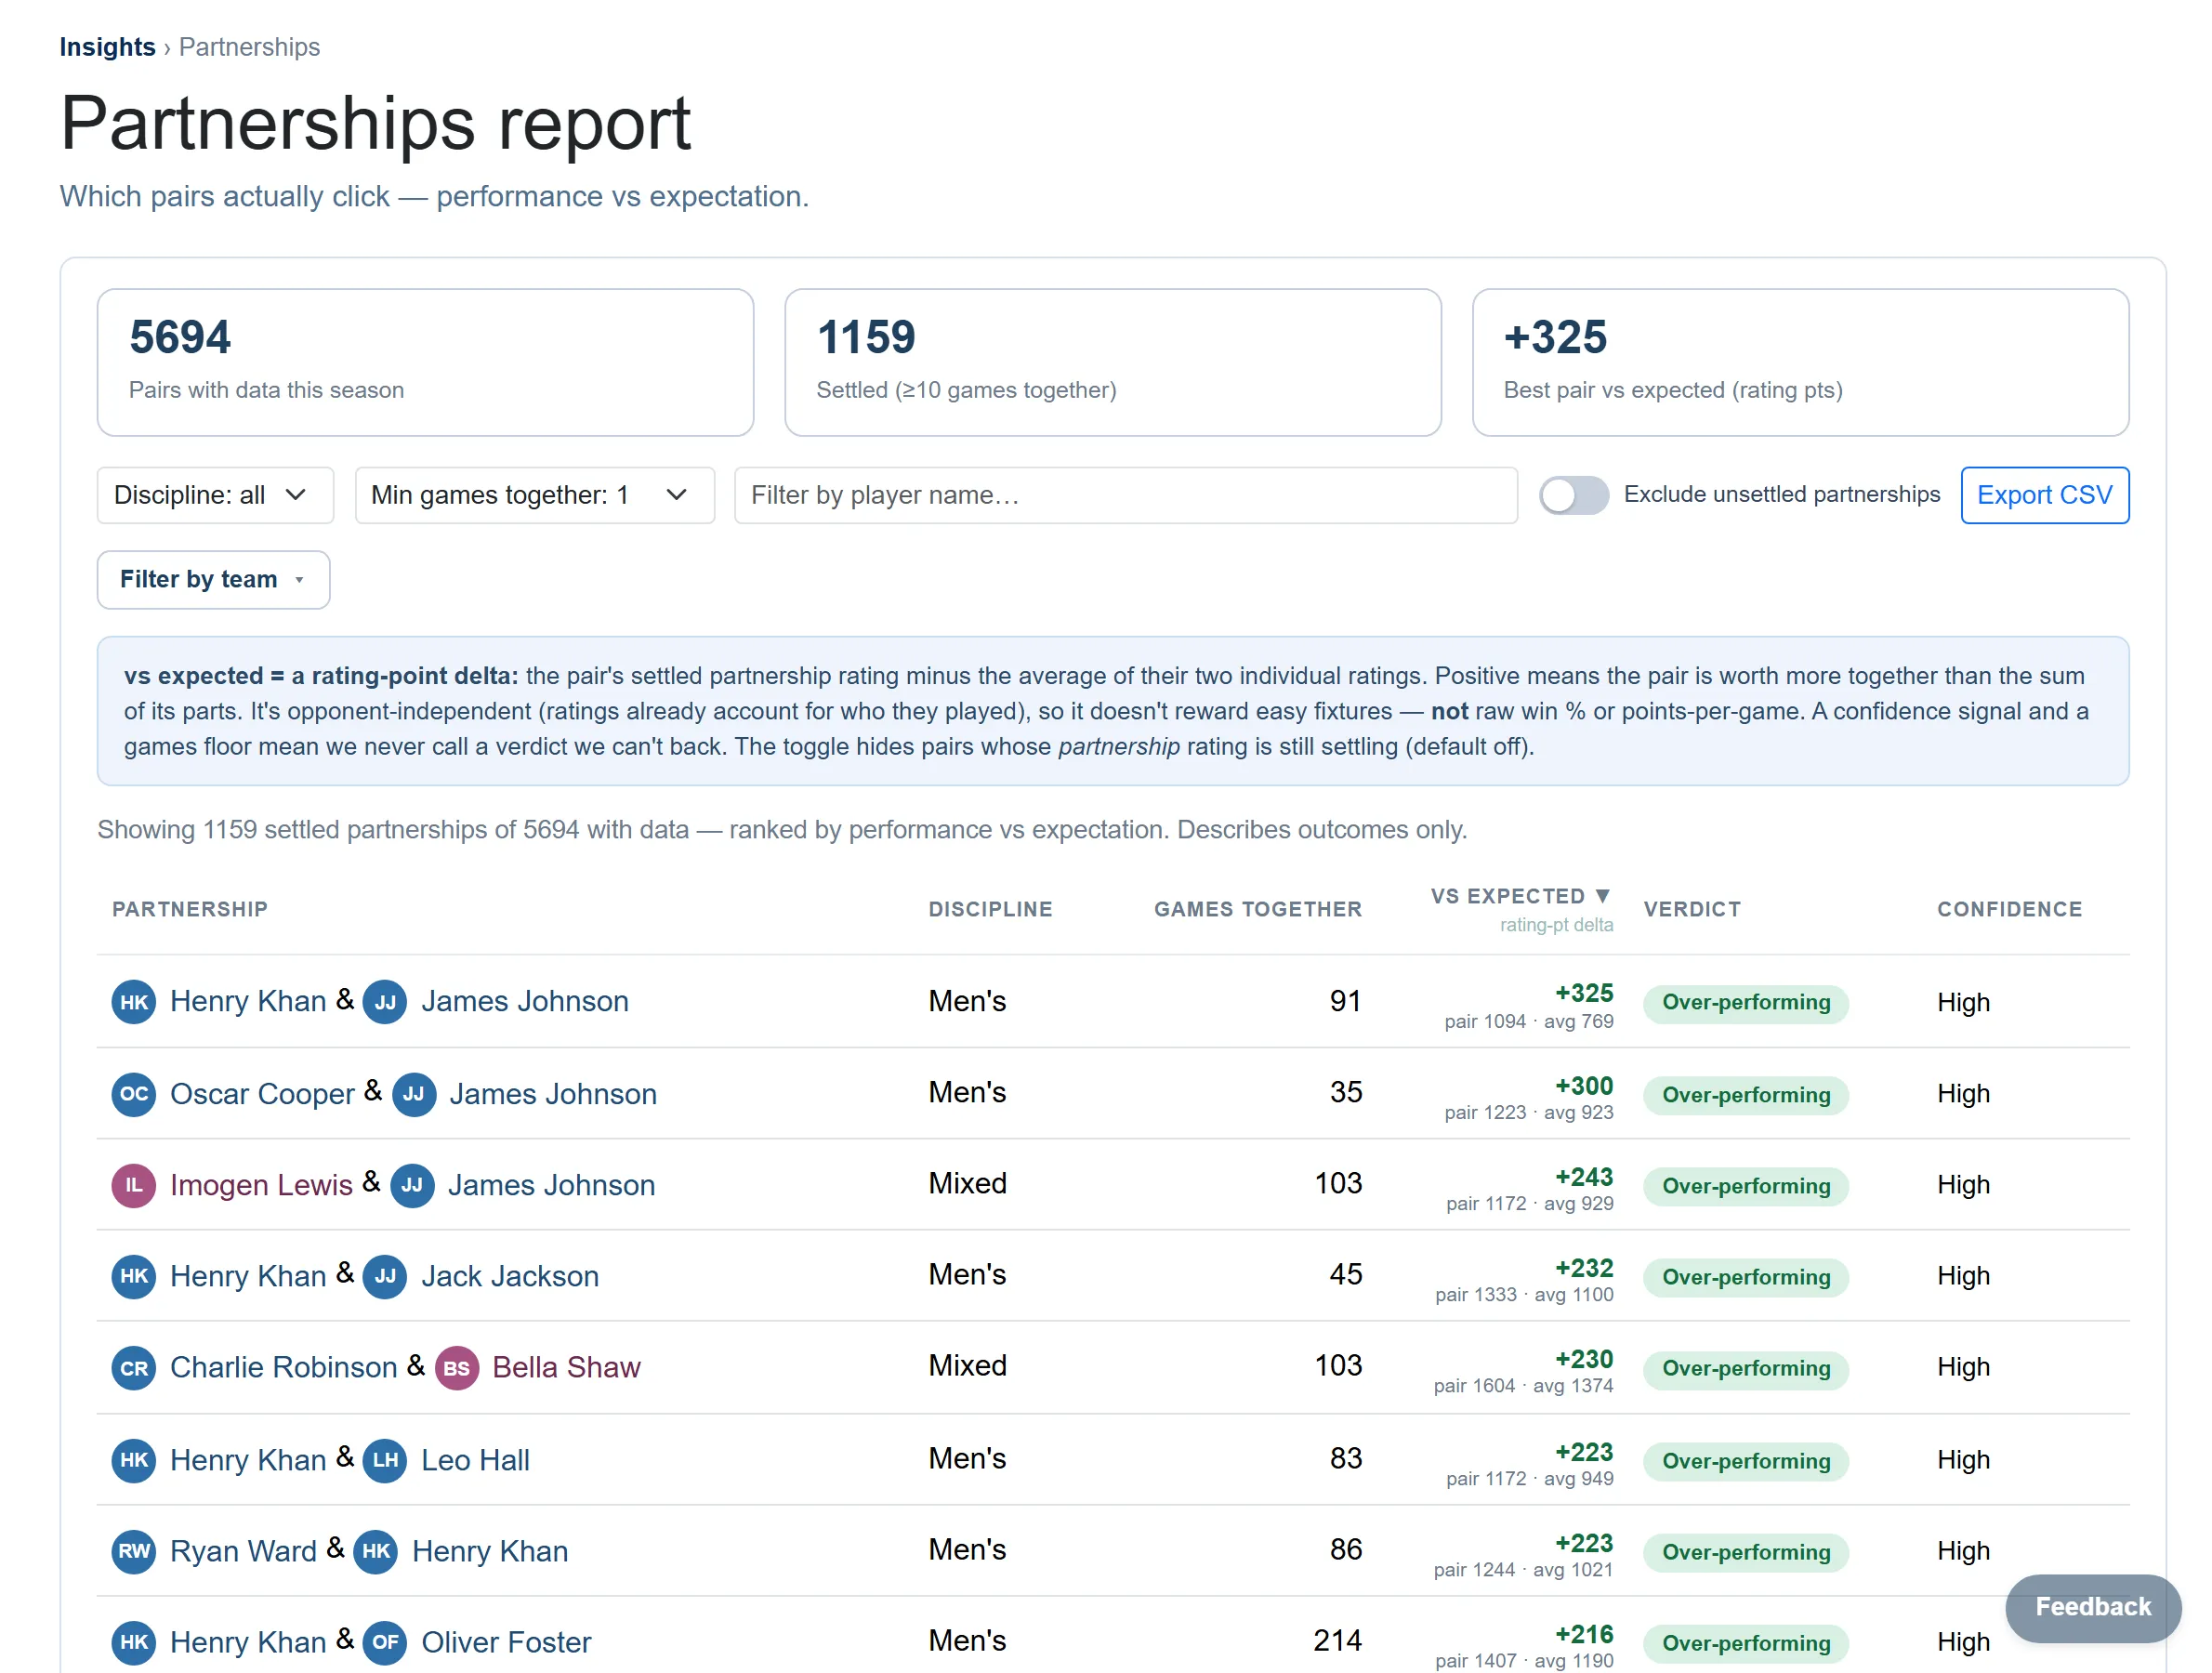
Section titled “Partnerships”Which pairs play well together, and which exceed or fall short of what their ratings expect.
For each settled pair (enough games played together) it shows the discipline (mixed, men’s or ladies’), the games they have played as a pair, how they perform versus expected as a rating-point difference, a verdict (over-performing, as expected, or under-performing), and a confidence level. Pairs that have not yet played enough together appear in a “still settling” section with how many more games they need. A team-roster filter lets you focus on a squad you are selecting.
Use it to find the partnerships that genuinely click, decide who to keep together for league or tournament play, and see which new pairings are still settling.
Payment summary
Section titled “Payment summary”Fees expected, collected, and still outstanding.
Switch between a by session view (expected, paid and outstanding for each night, with sessions that have money owing highlighted) and a by member view (what each member owes across the range). Both show totals, and the CSV export follows whichever view you are on. Quick buttons cover the common ranges (last month, three months, year to date, and so on).
Use it to keep on top of money: see which nights have fees outstanding, find members with a balance to chase, and reconcile what you have actually collected. (Payments in ePegboard are a tally, not a card processor - see Payments.)
Attendee stats (during a session)
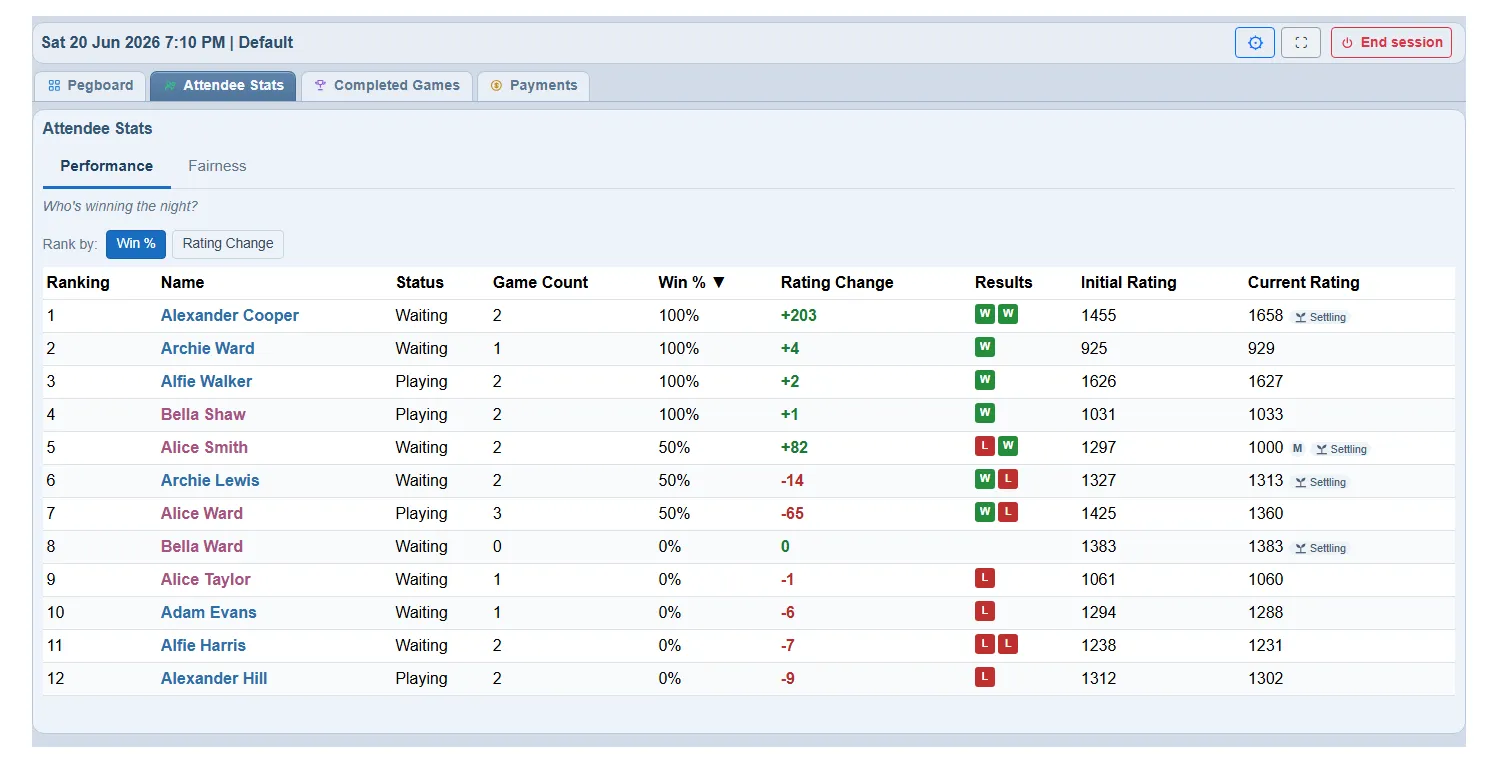
Section titled “Attendee stats (during a session)”A live leaderboard for the session in progress, on the session board’s Attendee stats tab rather than the Insights area.
Two views. Performance ranks players by win rate or rating change, with games played, a run of recent results, and starting and current ratings (new players show a “settling” marker). Fairness shows court time against expected for time present, so you can see at a glance whether everyone is getting their fair share of games. Click any player to expand their game-by-game detail and sit-out periods.
Use it during the night to keep things fair and answer “how am I doing?” on the spot, and at the end to crown the winners.
Related
Section titled “Related”- Sessions - running a club night
- How ratings work - the rating behind the performance and partnership figures
- Payments - how the fee tally works